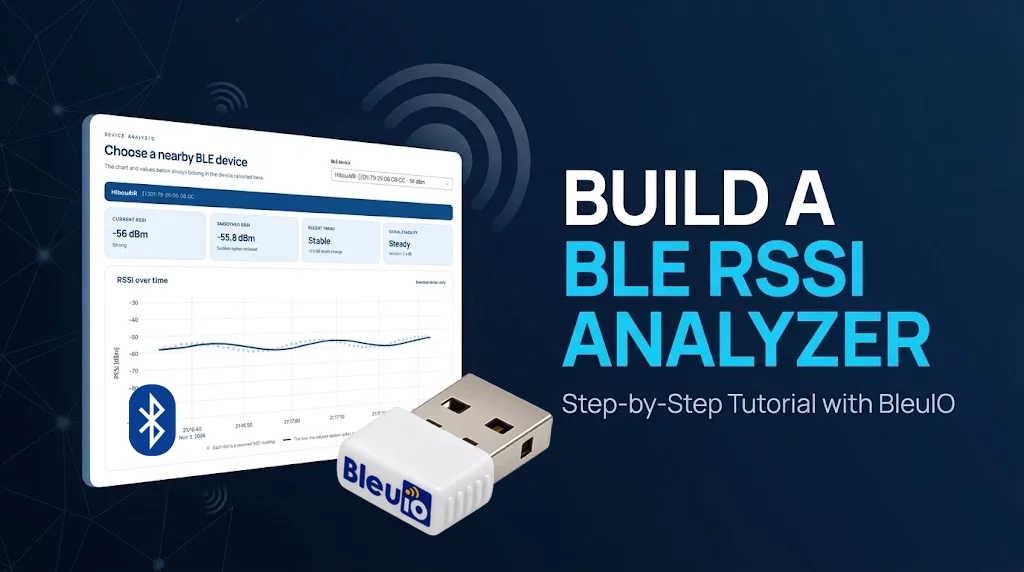
Build a BLE Signal Strength Analyzer with Live Charts Using BleuIO, Python and Plotly
RSSI analysis becomes much easier when you can see the signal changing instead of watching a stream of numbers in a terminal. A chart makes it possible to notice movement, sudden drops, periods of ins


